Meiosis Explained

Friday, January 21, 2011

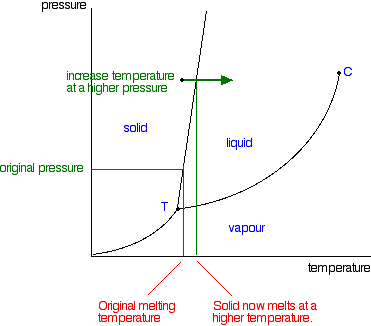
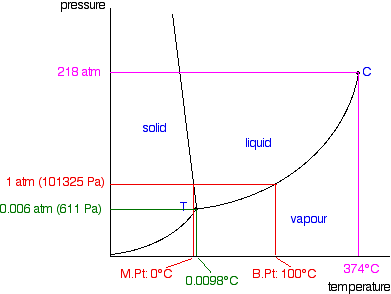
It is a type of cell division that occurs only in the reproductive cells and hence it is known as germ cell division. The daughter cells resulting from meiosis will carry half the number of chromosomes and half the amount of genetic material compared to the parent cell. Hence, meiosis is also known as reductional division.
fig. 17.5 - Stages of Meiosis
Meiosis occurs during the formation of gametes (spermatozoa and ova) in animals and spores in higher plants. It is mainly meant for bringing about a decrease in the chromosome number from the diploid (2n) condition to the haploid (n) condition.
The most characteristic feature in meiosis is that nucleus divides twice successively. Hence, meiosis is conventionally divided into first meiotic division (or meiosis - I) and second meiotic division (or meiosis - II).
In both the meiotic divisions, karyokinesis can be distinguished into four stages - prophase, metaphase, anaphase and telophase.

First Meiotic Division

The first meiotic division or meiosisI is commonly described as reductional division since at the end of this division the two resulting daughter cells will have half the number of chromosomes as that of the parent cell.

Interphase

It is the preparatory phase. Cell organells replicate and size of the cell increases. DNA molecule undergoes replication. Each chromosome exists as a pair of chromatids joined together by a centromere.
fig. 17.6 Stages of Meiosis-I

Prophase I

It is the phase of longest duration and involves a series of significant changes in the chromosomes. These changes are often described in five substages namely leptontene, zygotene, pachytene, diplotene and diakinesis.

Leptotene

  • : Chromosomes shorten and become visible as single structures. In some cases they have a beaded appearance showing densely staining material called chromomeres alternating with nonstaining regions.

Zygotene

  • : Paternal and maternal chromosomes come together and pair up. This pairing of homologous chromosmes is called synapsis. The paired chromosomes are described as bivalents. The bivalents shorten and thicken (spiralisation).

Pachytene

  • : Each chromosome splits into two chromatids and thus each pair will have four chromatids two paternal and two maternal. They are now called tetrads. The non-sister chromatids of the paternal and maternal chromosomes overlap each other. They appear to be joined at several regions along their length. These points are called Chiasmata. Each chiasma is the site of an exchange of genetic material between the two chromatids. It occurs due to breakage and reunion between the two non-sister chromatids. This process is called genetic recombination.

Diplotene

  • : The synaptic forces holding the two chromosomes in the pair come to an end. The chromosomes start separating. This separation is called as disjunction.

Diakinesis

  • : Separation of the chromosomes is now complete with paternal and maternal chromosomes having exchanged portions of chromatids. The chromosomes condense again. The chiasmata disappear by sliding towards the tips of the chromatids. This process is called terminalisation.
By the time these changes are completed in the chromosomes, the nuclear membrane and nucleolus disappear. Asters and spindle fibres make their appearance.
illustrtion of meiosis I process
fig. 17.7 - Behaviour of Chromosomes during Meiosis-I

Metaphase-I

In this change of a very brief duration, the chromosomes move towards the equator of the cell and come to lie in two parallel metaphase plates. These two parallel plates are formed by one set each of the homologous chromosomes. Each homologous chromosome has two kinetochores, one for each of its two chromatids.

Anaphase-I

There is no splitting of the centromere. As a result homologous chromosomes of each pair rather than the chromatids of a chromosome separate and move to the opposite poles. As a result, half the number of chromosomes that appear in the early prophase, move to each opposite pole. It is here that an actual reduction in the chromosome number (from (2n) to (n)) occurs. However, each chromosome found at the poles consists of two chromatids.
This is in contrast to the single stranded chromosomes in the anaphase of mitosis.

Telophase-I

The chromosomes at each pole uncoil and elongate to form the chromatin. A nucleolus reappears at each pole. Spindle fibres and asters disappear and centrioles split. A nuclear membrane is formed at each pole resulting in the formation of two daughter nuclei.

Cytokinesis - I

Simultaneously with the formation of two daughter nuclei, a cleavage furrow appears in the middle of the cell. The furrows gradually deepen and divide the cell into two daughter cells. Each of the resulting daughter cell prepares itself to undergo the second meiotic division.

Interkinesis

There is no interphase preceding second meiotic division. There is a brief intervening period called interkinesis. During this period there may be synthesis of some reserve food and proteins. However, there is no replication of DNA prior to meiosis II.

Second Meiotic Division

The second meiotic division or meiosis II almost always follows the first meiotic division. This division is primarily meant for separating the two chromatids of each chromosomes. Meiosis-II also has a Karyokinesis and a cytokinesis.
Karyokinesis of meiosis-II (Karyokinesis-II) can be distinguished into four stages namely prophase-II, metaphase-II, anaphase-II and telophase-II.

Prophase-II

It is of a short duration compared to prophase-I. No significant changes take place in the chromosomes. Nuclear membrane and nucleolus disappear. Asters and spindle fibres are formed.

Metaphase-II

The chromosomes line up at the equator of the cell forming a single metaphase plate (as in mitosis).
illustration of meiosis-II stages
fig. 17.8 - Stages of Meiosis-II

Anaphase-II

The centromere splits and two chromatids in each chromosome start moving away from each other. Finally, they reach the poles of the cell. Each pole now has haploid number of chromosomes and half the amount of DNA.

Telophase-II

Chromosomes at each pole uncoil and elongate to form chromatin. Nucleolus and nuclear membrane are formed surrounding each chromatin network. Asters and spindle fibres disappear and centrioles divide. Daughter nuclei are formed.

Cytokinesis-II

A cleavage furrow appears in the middle of the cell, deepens gradually and divides the cell into two.
Thus, at the end of second meiotic division, four daughter cells are formed. Each daughter cell has not only half the number of chromosomes but also half the amount of DNA, as that of the parent cell. Thus, the resulting cells are truly haploid cells.

Significance of Meiosis

Meiosis becomes significant for the following reasons.
  • It brings about a reduction in the chromosome number from a diploid (2n) condition to a haploid (n) condition. Such a reduction becomes necessary for maintaining the chromosome number.
  • It provides chance for the appearance of new gene combinations as a result of crossing over. This situation brings about variations.
  • It is a division necessary for the formation of gametes in animals and spores in plants.
Both mitosis and meiosis essentially follow the same sequence in all living organisms, which is an evidence of the basic relationship between diverse groups of living organisms

Mitosis Explained

It is a common type of cell division that occurs in all the cells of an organism. Hence, it is commonly called as somatic cell division. In mitosis, the resulting daughter cells will have the same number of chromosomes and contain the same amount of DNA, as that of the parent cell. Hence, mitosis is commonly described as equational division.
Mitosis occurs in two stages namely karyokinesis, the division of nucleus and cytokinesis, the division of cytoplasm. Just prior to karyokinesis, the cell will be in interphase.
illustration of mitosis stages
fig. 17.2 - Stages of Mitosis

Interphase

It is the preparing phase. It is of varying duration depending on the cell type function. It is the period in which the cell carries out synthesis of organelles and increases in size. The nucleoli are prominent and actively synthesising ribosomes. Just prior to division, the DNA undergoes replication. Each chromosome exists as a pair of chromatids joined together by a centromere.

Karyokinesis

It is the division of nuclear material, represented by a sequence of events in the cell. It can be distinguished into four phases namely prophase, metaphase, anaphase and telophase.

Prophase

It is the longest stage of the division cycle. It is characterised by significant changes.
  • Chromatids shorten (to about 4% of their original length) and thicken by spiralisation and condensation of DNA
  • Centrioles move to the opposite poles of the cell
  • Short microtubules develop, radiating from the centrioles. These are called asters
  • Nucleolus gradually decreases in size and disappears
  • Nuclear membrane disintegrates
  • Spindle fibres appear in the cytoplasm

Metaphase

In this phase, chromosomes move to the equator of the cell.
  • Pairs of chromatids become attached to the spindle fibres at their centromeres
pictorial illustration of mitosis process
fig. 17.3 - Stages of Mitosis

Anaphase

It is a rapid stage.
  • Each centromere splits into two
  • Spindle fibres pull the daughter centromeres to the opposite poles
  • The separated chromatids, now called chromosomes, are pulled along with centromeres to the opposite poles

Telophase

It is the last phase of Karyokinesis.
  • Chromosomes reach the poles of the cell, uncoil and lengthen to form chromatin
  • Spindle fibres disintegrate and centrioles replicate
  • A nuclear membrane is formed around chromosomes in each pole
  • Two daughter nuclei are formed
As telophase is in progress, cytokinesis begins in the cell.

Cytokinesis

It is the division of cytoplasm. It occurs in animal cells by the appearance of a furrow in the middle of the cell. The furrow deepens and divides the cell into two. Two daughter cells are formed.
comparison of mitosis in plant and animal cell
fig. 17.4 - Differences between Mitosis in Plant and Animal cells

Significance of Mitosis

Mitosis becomes significant for the following reasons.
  • Mitosis forms two daughter cells which will have the same chromosome number and same genetic material as the parent cell.
  • Daughter cells formed from mitosis are genetically identical to their parent cell and no variation would be introduced during mitosis. This results in genetic stability within the populations of cells derived from parental cells, as in a clone.
  • The number of cells within an organism increases by mitosis and this process is called hyperplasia. It forms the basis for growth.
If mitotic division goes uncontrolled in any part of the body, it results in the formation of malignant cells. These cells continue to divide resulting in the formation of malignant tumours. This condition is called cancer.
  • Mitosis is the basis of asexual reproduction in both plants and animals. This becomes the basis for vegetative propagation.
  • Mitosis is also responsible for repair and regeneration of the injured and lost parts of the body.

Intro to the Cell Cycle

Every cell that is capable of undergoing division passes through a cyclic sequence of events involving growth and division. It is called Cell Cycle. It encompasses the entire sequence of events that occur in a cell from the time it is formed from its parent cell till the time of its own division into daughter cells.
Cell cycle has three main stages namely:

Interphase

This is a period of intense synthesis and growth in the cell. The cell produces many materials required for its own growth and activities. The genetic material DNA replicates during interphase.

Karyokinesis

It is the process of nuclear division, which involves separation of chromatids and their redistribution as chromosomes into daughter cells.

Cytokinesis

It is the process of division of the cytoplasm to result in the formation of daughter cells.
cell cycle schematic representation
fig. 17.1 - The Cell Cycle
 Phase  Events within cell
 G1  Intensive cellular synthesis, mitochondria, chloroplasts (in plants), ER, lysosomes, golgi complex, vacuoles and vesicles produced. Nucleus produces rRNA, mRNA and tRNA and ribosomes are synthesised. Cell produces structural and functional proteins. Cell metabolic rate high and controlled by enzymes. Cell growth occurs. Substances produced to inhibit or stimulate onset of next phase.
 S  DNA replication occurs. Protein molecules called histones are synthesised and cover each DNA strand, Each chromosome has become two chromatids.
 G2  Intensive cellular synthesis. Mitochondria and chloroplasts divide. Energy stores increase. Mitotic spindle begins to form.
 Mitosis  Nuclear division occurs in four phases
 C  Equal distribution of organelles and cytoplasm into each daughter cells
The length of the cycle depends on the nature of cell and various external factors like temperature food and oxygen availability. Bacterial cells may divide every 20 minutes, epithelial cells living the small intestine divide once in 8 to 10 hours, onion root tip cells take about 20 hours to divide. Some specialised cells like the nerve cells never divide.

Raoult's Law and Non-volatile Solutes

Wednesday, January 19, 2011

This page deals with Raoult's Law and how it applies to solutions in which the solute is non-volatile - for example, a solution of salt in water. A non-volatile solute (the salt, for example) hasn't got any tendency to form a vapour at the temperature of the solution.
It goes on to explain how the resulting lowering of vapour pressure affects the boiling point and freezing point of the solution.


Important:  If you haven't already read the page about saturated vapour pressure, you should follow this link before you go on. Use the BACK button on your browser to return to this page when you are ready.


Raoult's Law There are several ways of stating Raoult's Law, and you tend to use slightly different versions depending on the situation you are talking about. You can use the simplified definition in the box below in the case of a single volatile liquid (the solvent) and a non-volatile solute.


The vapour pressure of a solution of a non-volatile solute is equal to the vapour pressure of the pure solvent at that temperature multiplied by its mole fraction.
In equation form, this reads:

In this equation, Po is the vapour pressure of the pure solvent at a particular temperature.
xsolv is the mole fraction of the solvent. That is exactly what it says it is - the fraction of the total number of moles present which is solvent.
You calculate this using:

Suppose you had a solution containing 10 moles of water and 0.1 moles of sugar. The total number of moles is therefore 10.1
The mole fraction of the water is:

A simple explanation of why Raoult's Law works
There are two ways of explaining why Raoult's Law works - a simple visual way, and a more sophisticated way based on entropy. Because of the level I am aiming at, I'm just going to look at the simple way.
Remember that saturated vapour pressure is what you get when a liquid is in a sealed container. An equilibrium is set up where the number of particles breaking away from the surface is exactly the same as the number sticking on to the surface again.

Now suppose you added enough solute so that the solvent molecules only occupied 50% of the surface of the solution.

A certain fraction of the solvent molecules will have enough energy to escape from the surface (say, 1 in 1000 or 1 in a million, or whatever). If you reduce the number of solvent molecules on the surface, you are going to reduce the number which can escape in any given time.
But it won't make any difference to the ability of molecules in the vapour to stick to the surface again. If a solvent molecule in the vapour hits a bit of surface occupied by the solute particles, it may well stick. There are obviously attractions between solvent and solute otherwise you wouldn't have a solution in the first place.
The net effect of this is that when equilibrium is established, there will be fewer solvent molecules in the vapour phase - it is less likely that they are going to break away, but there isn't any problem about them returning.
If there are fewer particles in the vapour at equilibrium, the saturated vapour pressure is lower.
Limitations on Raoult's Law
Raoult's Law only works for ideal solutions. An ideal solution is defined as one which obeys Raoult's Law.
Features of an ideal solution
In practice, there's no such thing! However, very dilute solutions obey Raoult's Law to a reasonable approximation. The solution in the last diagram wouldn't actually obey Raoult's Law - it is far too concentrated. I had to draw it that concentrated to make the point more clearly.
In an ideal solution, it takes exactly the same amount of energy for a solvent molecule to break away from the surface of the solution as it did in the pure solvent. The forces of attraction between solvent and solute are exactly the same as between the original solvent molecules - not a very likely event!

Suppose that in the pure solvent, 1 in 1000 molecules had enough energy to overcome the intermolecular forces and break away from the surface in any given time. In an ideal solution, that would still be exactly the same proportion.
Fewer would, of course, break away because there are now fewer solvent molecules on the surface - but of those that are on the surface, the same proportion still break away.
If there were strong solvent-solute attractions, this proportion may be reduced to 1 in 2000, or 1 in 5000 or whatever.
In any real solution of, say, a salt in water, there are strong attractions between the water molecules and the ions. That would tend to slow down the loss of water molecules from the surface. However, if the solution is sufficiently dilute, there will be good-sized regions on the surface where you still have water molecules on their own. The solution will then approach ideal behaviour.
The nature of the solute
There is another thing that you have to be careful of if you are going to do any calculations on Raoult's Law (beyond the scope of this site). You may have noticed in the little calculation about mole fraction further up the page, that I used sugar as a solute rather than salt. There was a good reason for that!
What matters isn't actually the number of moles of substance that you put into the solution, but the number of moles of particles formed. For each mole of sodium chloride dissolved, you get 1 mole of sodium ions and 1 mole of chloride ions - in other words, you get twice the number of moles of particles as of original salt.

So, if you added 0.1 moles of sodium chloride, there would actually be 0.2 moles of particles in the solution - and that's the figure you would have to use in the mole fraction calculation.
Unless you think carefully about it, Raoult's Law only works for solutes which don't change their nature when they dissolve. For example, they mustn't ionise or associate (in other words, if you put in substance A, it mustn't form A2 in solution).
If it does either of these things, you have to treat Raoult's law with great care.


Note:  This isn't a problem you are likely to have to worry about if you are a UK A level student. Just be aware that the problem exists.


Raoult's Law and melting and boiling points The effect of Raoult's Law is that the saturated vapour pressure of a solution is going to be lower than that of the pure solvent at any particular temperature. That has important effects on the phase diagram of the solvent.
The next diagram shows the phase diagram for pure water in the region around its normal melting and boiling points. The 1 atmosphere line shows the conditions for measuring the normal melting and boiling points.


Note:  In common with most phase diagrams, this is drawn highly distorted in order to show more clearly what is going on. If you haven't already read my page about phase diagrams for pure substances, you should follow this link before you go on to make proper sense of what comes next.
Use the BACK button on your browser to return to this page when you are ready.


The line separating the liquid and vapour regions is the set of conditions where liquid and vapour are in equilibrium.
It can be thought of as the effect of pressure on the boiling point of the water, but it is also the curve showing the effect of temperature on the saturated vapour pressure of the water. These two ways of looking at the same line are discussed briefly in a note about half-way down the page about phase diagrams (follow the last link above).
If you draw the saturated vapour pressure curve for a solution of a non-volatile solute in water, it will always be lower than the curve for the pure water.


Note:  The curves for the pure water and for the solution are often drawn parallel to each other. That has got to be wrong! Suppose you have a solution where the mole fraction of the water is 0.99 and the vapour pressure of the pure water at that temperature is 100 kPa. The vapour pressure of the solution will be 99 kPa - a fall of 1 kPa. At a lower temperature, where the vapour pressure of the pure water is 10 kPa, the fall will only be 0.1 kPa. For the curves to be parallel the falls would have to be the same over the whole temperature range. They aren't!


If you look closely at the last diagram, you will see that the point at which the liquid-vapour equilibrium curve meets the solid-vapour curve has moved. That point is the triple point of the system - a unique set of temperature and pressure conditions at which it is possible to get solid, liquid and vapour all in equilibrium with each other at the same time.
Since the triple point has solid-liquid equilibrium present (amongst other equilibria), it is also a melting point of the system - although not the normal melting point because the pressure isn't 1 atmosphere.
That must mean that the phase diagram needs a new melting point line (a solid-liquid equilibrium line) passing through the new triple point. That is shown in the next diagram.

Now we are finally in a position to see what effect a non-volatile solute has on the melting and freezing points of the solution. Look at what happens when you draw in the 1 atmosphere pressure line which lets you measure the melting and boiling points. The diagram also includes the melting and boiling points of the pure water from the original phase diagram for pure water (black lines).

Because of the changes to the phase diagram, you can see that:
  • the boiling point of the solvent in a solution is higher than that of the pure solvent;
  • the freezing point (melting point) of the solvent in a solution is lower than that of the pure solvent.
We have looked at this with water as the solvent, but using a different solvent would make no difference to the argument or the conclusions.
The only difference is in the slope of the solid-liquid equilibrium lines. For most solvents, these slope forwards whereas the water line slopes backwards. You could prove to yourself that that doesn't affect what we have been looking at by re-drawing all these diagrams with the slope of that particular line changed.
You will find it makes no difference whatsoever.

Ideal Gases and the Ideal Gas Law

This page looks at the assumptions which are made in the Kinetic Theory about ideal gases, and takes an introductory look at the Ideal Gas Law: pV = nRT. This is intended only as an introduction suitable for chemistry students at about UK A level standard (for 16 - 18 year olds), and so there is no attempt to derive the ideal gas law using physics-style calculations.
Kinetic Theory assumptions about ideal gases
There is no such thing as an ideal gas, of course, but many gases behave approximately as if they were ideal at ordinary working temperatures and pressures. Real gases are dealt with in more detail on another page.
The assumptions are:
  • Gases are made up of molecules which are in constant random motion in straight lines.
  • The molecules behave as rigid spheres.
  • Pressure is due to collisions between the molecules and the walls of the container.
  • All collisions, both between the molecules themselves, and between the molecules and the walls of the container, are perfectly elastic. (That means that there is no loss of kinetic energy during the collision.)
  • The temperature of the gas is proportional to the average kinetic energy of the molecules.
And then two absolutely key assumptions, because these are the two most important ways in which real gases differ from ideal gases:
  • There are no (or entirely negligible) intermolecular forces between the gas molecules.
  • The volume occupied by the molecules themselves is entirely negligible relative to the volume of the container.
The Ideal Gas Equation
The ideal gas equation is:
pV = nRT
On the whole, this is an easy equation to remember and use. The problems lie almost entirely in the units. I am assuming below that you are working in strict SI units (as you will be if you are doing a UK-based exam, for example).
Exploring the various terms
Pressure, p
Pressure is measured in pascals, Pa - sometimes expressed as newtons per square metre, N m-2. These mean exactly the same thing.
Be careful if you are given pressures in kPa (kilopascals). For example, 150 kPa is 150,000 Pa. You must make that conversion before you use the ideal gas equation.
Should you want to convert from other pressure measurements:
  • 1 atmosphere = 101,325 Pa
  • 1 bar = 100 kPa = 100,000 Pa
Volume, V
This is the most likely place for you to go wrong when you use this equation. That's because the SI unit of volume is the cubic metre, m3 - not cm3 or dm3.
1 m3 = 1000 dm3 = 1,000,000 cm3
So if you are inserting values of volume into the equation, you first have to convert them into cubic metres.
You would have to divide a volume in dm3 by 1000, or in cm3 by a million. Similarly, if you are working out a volume using the equation, remember to covert the answer in cubic metres into dm3 or cm3 if you need to - this time by multiplying by a 1000 or a million.
If you get this wrong, you are going to end up with a silly answer, out by a factor of a thousand or a million. So it is usually fairly obvious if you have done something wrong, and you can check back again.
Number of moles, n
This is easy, of course - it is just a number. You already know that you work it out by dividing the mass in grams by the mass of one mole in grams.
You will most often use the ideal gas equation by first making the substitution to give:

I don't recommend that you remember the ideal gas equation in this form, but you must be confident that you can convert it into this form.
The gas constant, R
A value for R will be given you if you need it, or you can look it up in a data source. The SI value for R is 8.31441 J K-1 mol-1.


Note:  You may come across other values for this with different units. A commonly used one in the past was 82.053 cm3 atm K-1 mol-1. The units tell you that the volume would be in cubic centimetres and the pressure in atmospheres. Unfortunately the units in the SI version aren't so obviously helpful.


The temperature, T
The temperature has to be in kelvin. Don't forget to add 273 if you are given a temperature in degrees Celsius.
Using the ideal gas equation
Calculations using the ideal gas equation are included in my calculations book (see the link at the very bottom of the page), and I can't repeat them here. There are, however, a couple of calculations that I haven't done in the book which give a reasonable idea of how the ideal gas equation works.
The molar volume at stp
If you have done simple calculations from equations, you have probably used the molar volume of a gas.
1 mole of any gas occupies 22.4 dm3 at stp (standard temperature and pressure, taken as 0°C and 1 atmosphere pressure). You may also have used a value of 24.0 dm3 at room temperature and pressure (taken as about 20°C and 1 atmosphere).
These figures are actually only true for an ideal gas, and we'll have a look at where they come from.
We can use the ideal gas equation to calculate the volume of 1 mole of an ideal gas at 0°C and 1 atmosphere pressure.
First, we have to get the units right.
0°C is 273 K. T = 273 K
1 atmosphere = 101325 Pa. p = 101325 Pa
We know that n = 1, because we are trying to calculate the volume of 1 mole of gas.
And, finally, R = 8.31441 J K-1 mol-1.
Slotting all of this into the ideal gas equation and then rearranging it gives:

And finally, because we are interested in the volume in cubic decimetres, you have to remember to multiply this by 1000 to convert from cubic metres into cubic decimetres.
The molar volume of an ideal gas is therefore 22.4 dm3 at stp.
And, of course, you could redo this calculation to find the volume of 1 mole of an ideal gas at room temperature and pressure - or any other temperature and pressure.
Finding the relative formula mass of a gas from its density
This is about as tricky as it gets using the ideal gas equation.
The density of ethane is 1.264 g dm-3 at 20°C and 1 atmosphere. Calculate the relative formula mass of ethane.
The density value means that 1 dm3 of ethane weighs 1.264 g.
Again, before we do anything else, get the awkward units sorted out.
A pressure of 1 atmosphere is 101325 Pa.
The volume of 1 dm3 has to be converted to cubic metres, by dividing by 1000. We have a volume of 0.001 m3.
The temperature is 293 K.
Now put all the numbers into the form of the ideal gas equation which lets you work with masses, and rearrange it to work out the mass of 1 mole.

The mass of 1 mole of anything is simply the relative formula mass in grams.
So the relative formula mass of ethane is 30.4, to 3 sig figs.
Now, if you add up the relative formula mass of ethane, C2H6 using accurate values of relative atomic masses, you get an answer of 30.07 to 4 significant figures. Which is different from our answer - so what's wrong?
There are two possibilities.
  • The density value I have used may not be correct. I did the sum again using a slightly different value quoted at a different temperature from another source. This time I got an answer of 30.3. So the density values may not be entirely accurate, but they are both giving much the same sort of answer.
  • Ethane isn't an ideal gas. Well, of course it isn't an ideal gas - there's no such thing! However, assuming that the density values are close to correct, the error is within 1% of what you would expect. So although ethane isn't exactly behaving like an ideal gas, it isn't far off.
If you need to know about real gases, now is a good time to read about them.

Phase Diagrams of Pure Substances

This page explains how to interpret the phase diagrams for simple pure substances - including a look at the special cases of the phase diagrams of water and carbon dioxide. This is going to be a long page, because I have tried to do the whole thing as gently as possible.
The basic phase diagram What is a phase?
At its simplest, a phase can be just another term for solid, liquid or gas. If you have some ice floating in water, you have a solid phase present and a liquid phase. If there is air above the mixture, then that is another phase.
But the term can be used more generally than this. For example, oil floating on water also consists of two phases - in this case, two liquid phases. If the oil and water are contained in a bucket, then the solid bucket is yet another phase. In fact, there might be more than one solid phase if the handle is attached separately to the bucket rather than moulded as a part of the bucket.
You can recognise the presence of the different phases because there is an obvious boundary between them - a boundary between the solid ice and the liquid water, for example, or the boundary between the two liquids.
Phase diagrams
A phase diagram lets you work out exactly what phases are present at any given temperature and pressure. In the cases we'll be looking at on this page, the phases will simply be the solid, liquid or vapour (gas) states of a pure substance.
This is the phase diagram for a typical pure substance.

These diagrams (including this one) are nearly always drawn highly distorted in order to see what is going on more easily. There are usually two major distortions. We'll discuss these when they become relevant.
If you look at the diagram, you will see that there are three lines, three areas marked "solid", "liquid" and "vapour", and two special points marked "C" and "T".
The three areas
These are easy! Suppose you have a pure substance at three different sets of conditions of temperature and pressure corresponding to 1, 2 and 3 in the next diagram.

Under the set of conditions at 1 in the diagram, the substance would be a solid because it falls into that area of the phase diagram. At 2, it would be a liquid; and at 3, it would be a vapour (a gas).


Note:  I'm using the terms vapour and gas as if they were interchangeable. There are subtle differences between them that I'm not ready to explain for a while yet. Be patient!


Moving from solid to liquid by changing the temperature:
Suppose you had a solid and increased the temperature while keeping the pressure constant - as shown in the next diagram. As the temperature increases to the point where it crosses the line, the solid will turn to liquid. In other words, it melts.
If you repeated this at a higher fixed pressure, the melting temperature would be higher because the line between the solid and liquid areas slopes slightly forward.


Note:  This is one of the cases where we distort these diagrams to make them easier to discuss. This line is much more vertical in practice than we normally draw it. There would be very little change in melting point at a higher pressure. The diagram would be very difficult to follow if we didn't exaggerate it a bit.


So what actually is this line separating the solid and liquid areas of the diagram?
It simply shows the effect of pressure on melting point.
Anywhere on this line, there is an equilibrium between solid and liquid.
You can apply Le Chatelier's Principle to this equilibrium just as if it was a chemical equilibrium. If you increase the pressure, the equilibrium will move in such a way as to counter the change you have just made.
If it converted from liquid to solid, the pressure would tend to decrease again because the solid takes up slightly less space for most substances.
That means that increasing the pressure on the equilibrium mixture of solid and liquid at its original melting point will convert the mixture back into the solid again. In other words, it will no longer melt at this temperature.
To make it melt at this higher pressure, you will have to increase the temperature a bit. Raising the pressure raises the melting point of most solids. That's why the melting point line slopes forward for most substances.
Moving from solid to liquid by changing the pressure:
You can also play around with this by looking at what happens if you decrease the pressure on a solid at constant temperature.


Note:  You have got to be a bit careful about this, because exactly what happens if you decrease the pressure depends on exactly what your starting conditions are. We'll talk some more about this when we look at the line separating the solid region from the vapour region.


Moving from liquid to vapour:
In the same sort of way, you can do this either by changing the temperature or the pressure.
The liquid will change to a vapour - it boils - when it crosses the boundary line between the two areas. If it is temperature that you are varying, you can easily read off the boiling temperature from the phase diagram. In the diagram above, it is the temperature where the red arrow crosses the boundary line.
So, again, what is the significance of this line separating the two areas?
Anywhere along this line, there will be an equilibrium between the liquid and the vapour. The line is most easily seen as the effect of pressure on the boiling point of the liquid.
As the pressure increases, so the boiling point increases.


Note:  I don't want to make any very big deal over this, but this line is actually exactly the same as the graph for the effect of temperature on the saturated vapour pressure of the liquid. Saturated vapour pressure is dealt with on a separate page. A liquid will boil when its saturated vapour pressure is equal to the external pressure. Suppose you measured the saturated vapour pressure of a liquid at 50°C, and it turned out to be 75 kPa. You could plot that as one point on a vapour pressure curve, and then go on to measure other saturated vapour pressures at different temperatures and plot those as well.
Now, suppose that you had the liquid exposed to a total external pressure of 75 kPa, and gradually increased the temperature. The liquid would boil when its saturated vapour pressure became equal to the external pressure - in this case at 50°C. If you have the complete vapour pressure curve, you could equally well find the boiling point corresponding to any other external pressure.
That means that the plot of saturated vapour pressure against temperature is exactly the same as the curve relating boiling point and external pressure - they are just two ways of looking at the same thing.
If all you are interested in doing is interpreting one of these phase diagrams, you probably don't have to worry too much about this.


The critical point
You will have noticed that this liquid-vapour equilibrium curve has a top limit that I have labelled as C in the phase diagram.
This is known as the critical point. The temperature and pressure corresponding to this are known as the critical temperature and critical pressure.
If you increase the pressure on a gas (vapour) at a temperature lower than the critical temperature, you will eventually cross the liquid-vapour equilibrium line and the vapour will condense to give a liquid.

This works fine as long as the gas is below the critical temperature. What, though, if your temperature was above the critical temperature? There wouldn't be any line to cross!
That is because, above the critical temperature, it is impossible to condense a gas into a liquid just by increasing the pressure. All you get is a highly compressed gas. The particles have too much energy for the intermolecular attractions to hold them together as a liquid.
The critical temperature obviously varies from substance to substance and depends on the strength of the attractions between the particles. The stronger the intermolecular attractions, the higher the critical temperature.


Note:  This is now a good point for a quick comment about the use of the words "gas" and "vapour". To a large extent you just use the term which feels right. You don't usually talk about "ethanol gas", although you would say "ethanol vapour". Equally, you wouldn't talk about oxygen as being a vapour - you always call it a gas. There are various guide-lines that you can use if you want to. For example, if the substance is commonly a liquid at or around room temperature, you tend to call what comes away from it a vapour. A slightly wider use would be to call it a vapour if the substance is below its critical point, and a gas if it is above it. Certainly it would be unusual to call anything a vapour if it was above its critical point at room temperature - oxygen or nitrogen or hydrogen, for example. These would all be described as gases.
This is absolutely NOT something that is at all worth getting worked up about!


Moving from solid to vapour:
There's just one more line to look at on the phase diagram. This is the line in the bottom left-hand corner between the solid and vapour areas.
That line represents solid-vapour equilibrium. If the conditions of temperature and pressure fell exactly on that line, there would be solid and vapour in equilibrium with each other - the solid would be subliming. (Sublimation is the change directly from solid to vapour or vice versa without going through the liquid phase.)
Once again, you can cross that line by either increasing the temperature of the solid, or decreasing the pressure.
The diagram shows the effect of increasing the temperature of a solid at a (probably very low) constant pressure. The pressure obviously has to be low enough that a liquid can't form - in other words, it has to happen below the point labelled as T.


You could read the sublimation temperature off the diagram. It will be the temperature at which the line is crossed.
The triple point
Point T on the diagram is called the triple point.
If you think about the three lines which meet at that point, they represent conditions of:
  • solid-liquid equilibrium
  • liquid-vapour equilibrium
  • solid-vapour equilibrium
Where all three lines meet, you must have a unique combination of temperature and pressure where all three phases are in equilibrium together. That's why it is called a triple point.
If you controlled the conditions of temperature and pressure in order to land on this point, you would see an equilibrium which involved the solid melting and subliming, and the liquid in contact with it boiling to produce a vapour - and all the reverse changes happening as well.
If you held the temperature and pressure at those values, and kept the system closed so that nothing escaped, that's how it would stay. A strange set of affairs!
Normal melting and boiling points
The normal melting and boiling points are those when the pressure is 1 atmosphere. These can be found from the phase diagram by drawing a line across at 1 atmosphere pressure.

The phase diagram for water

There is only one difference between this and the phase diagram that we've looked at up to now. The solid-liquid equilibrium line (the melting point line) slopes backwards rather than forwards.
In the case of water, the melting point gets lower at higher pressures. Why?

If you have this equilibrium and increase the pressure on it, according to Le Chatelier's Principle the equilibrium will move to reduce the pressure again. That means that it will move to the side with the smaller volume. Liquid water is produced.
To make the liquid water freeze again at this higher pressure, you will have to reduce the temperature. Higher pressures mean lower melting (freezing) points.
Now lets put some numbers on the diagram to show the exact positions of the critical point and triple point for water.

Notice that the triple point for water occurs at a very low pressure. Notice also that the critical temperature is 374°C. It would be impossible to convert water from a gas to a liquid by compressing it above this temperature.
The normal melting and boiling points of water are found in exactly the same way as we have already discussed - by seeing where the 1 atmosphere pressure line crosses the solid-liquid and then the liquid-vapour equilibrium lines.


Note:  Further up the page I mentioned two ways in which these diagrams are distorted to make them easier to follow. I have already pointed out that the solid-liquid equilibrium line should really be much more vertical. This last diagram illustrates the other major distortion - which is to the scales of both pressure and temperature. Look, for example, at the gaps between the various quoted pressure figures and then imagine that you had to plot those on a bit of graph paper! The temperature scale is equally haphazard.


Just one final example of using this diagram (because it appeals to me). Imagine lowering the pressure on liquid water along the line in the diagram below.
The phase diagram shows that the water would first freeze to form ice as it crossed into the solid area. When the pressure fell low enough, the ice would then sublime to give water vapour. In other words, the change is from liquid to solid to vapour. I find that satisfyingly bizarre!
The phase diagram for carbon dioxide
The only thing special about this phase diagram is the position of the triple point which is well above atmospheric pressure. It is impossible to get any liquid carbon dioxide at pressures less than 5.11 atmospheres.
That means that at 1 atmosphere pressure, carbon dioxide will sublime at a temperature of -78°C.
This is the reason that solid carbon dioxide is often known as "dry ice". You can't get liquid carbon dioxide under normal conditions - only the solid or the vapour.

Glycolysis

Monday, January 17, 2011

Glycolysis serves as the foundation for both aerobic and anaerobic cellular respiration.
Glycolysis is the metabolic process that serves as the foundation for both aerobic and anaerobic cellular respiration. In glycolysis, glucose is converted into pyruvate.

Step 1
The first step in glycolysis is the conversion of D-glucose into glucose-6-phosphate.
The first step in glycolysis is the conversion of D-glucose into glucose-6-phosphate. The enzyme that catalyzes this reaction is hexokinase.

Step 2
The second reaction of glycolysis is the rearrangement of G6P into F6P.
The second reaction of glycolysis is the rearrangement of glucose 6-phosphate (G6P) into fructose 6-phosphate (F6P) by glucose phosphate isomerase.

 Step 3
Phosphofructokinase changes fructose 6-phosphate into fructose 1,6-bisphosphate.
Phosphofructokinase, with magnesium as a cofactor, changes fructose 6-phosphate into fructose 1,6-bisphosphate.

Step 4
Aldolase splits the hexose ring of glucose 1,6-bisphosphate into two triose sugars.
Aldolase splits the hexose ring of glucose 1,6-bisphosphate into two triose sugars, dihydroxyacetone phosphate, a ketone, and glyceraldehyde 3-phosphate, an aldehyde.

Step 5
Triosephosphate isomerase converts dihydroxyacetone phosphate into glyceraldehyde 3-phosphate.
Triosephosphate isomerase converts dihydroxyacetone phosphate (DHAP) into glyceraldehyde 3-phosphate (GADP)

Step 6
GAPDH changes glyceraldehyde 3-phosphate into 1,3-bisphosphoglycerate.
Glyceraldehyde phosphate dehydrogenase (GAPDH) dehydrogenates and adds an inorganic phosphate to glyceraldehyde 3-phosphate, producing 1,3-bisphosphoglycerate.

Step 7
Phosphoglycerate kinase changes 1,3-bisphosphoglycerate to 3-phosphoglycerate.
Phosphoglycerate kinase transfers a phosphate group from 1,3-bisphosphoglycerate to ADP for form ATP and 3-phosphoglycerate.

Step 8
Phosphoglycerate mutase changes 3-phosphoglycerate into 2-phosphoglycerate.

Step 9
Enolase with magnesium as a cofactor changes 2-phosphoglycerate into phosphoenolpyruvate.
Enolase with magnesium as a cofactor changes 2-phosphoglycerate into phosphoenolpyruvate

Step 10
Pyruvate kinase with magnesium as a cofactor changes phosphoenolpyruvate into pyruvate.


END
Oxidative decarboxylation is the route most organisms take to enter the citric acid cycle.
Oxidative decarboxylation isn't part of glycolysis, but it is the route most organisms take to enter the citric acid cycle. Pyruvate dehydrogenase converts pyruvate into acetyl coA.